4.76 out of 5
4.76
71 reviews on Udemy

Python for Finance and Data Science

Learn Python Programming and apply Financial Data Science to REAL data - from Beginner to Professional
Instructor:
Algovibes YT
469 students enrolled
English [Auto]
Learn how to code in Python from scratch
Be a PRO in Data Analysis in specific Financial Data
Build and Backtest Trading Strategies with Python
Understand and Optimize the Return and Risk profile of your Portfolio
Compare stocks and Portfolio in terms of their Sharpe ratio
Have an outstanding technical skillset to apply for a quant job in a financial institution or data based company
Be able to perform in depth Investment Analysis
Solve real-world problems using Python
Visualize your data in interactive Dashboards
Learn about best practices and relevant practice advice working with financial data
Be able to compare stocks
Understand the difference between Log returns and returns
Optimize weights by using the concept of the Efficient Frontier
Leverage Algebra concepts to do powerful calculations
Learn to use the powerful intersection of Pandas & SQL to build, maintain and leverage Databases
Understand how you can leverage Algebra to make powerful computations

Are you ready to revolutionize your understanding of Finance and Data Science?

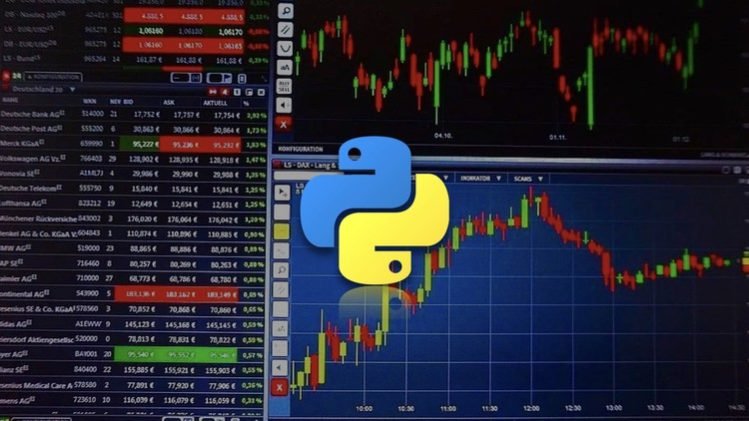
Dive into the world of Python for Finance and Data Science, where cutting-edge technology meets the dynamic field of financial analysis.

In this comprehensive course, I will guide you through the essential principles and practical techniques that will supercharge your financial analysis skills. Whether you’re an aspiring financial professional, data scientist, quant-oriented or simply eager to expand your knowledge, this course will empower you to extract valuable insights from financial data and make informed decisions.

Harness the power of Python, the industry’s leading programming language for data analysis and automation. Explore the intricacies of financial data retrieval, preprocessing, manipulation and gain the tools to transform raw data into compelling visualizations and intuitive dashboards.

Discover how to implement Portfolio Analysis and Portfolio optimization techniques, all using Python. Uncover hidden patterns in the data, build and backtest trading strategies, and explore algorithmic trading possibilities.

But it doesn’t stop there! This course goes beyond finance by incorporating essential data science concepts. You’ll master the art of Data manipulation, Portfolio Analysis, Applied Financial Analysis, Backtesting and uncover critical business insights.

Get ready for hands-on exercises, real-world examples, and expert guidance from an actively working quant finance professional

My engaging curriculum ensures a seamless learning experience as I am equipping you with the skills to excel in the fast-paced world of finance and Data Science.

Don’t miss this opportunity to transform your career and gain a competitive edge in the financial or data industry. Enroll now and unleash the full potential of Python for Finance and Data Science!

What will YOU learn in specific?

  • Fundamental Python Programming

  • An Introduction to one of the most powerful Data Science and Financial Data Analysis Libraries: Pandas

  • A FULL guide into applied Financial Data Analysis

  • A FULL guide into Portfolio Analysis and Portfolio Management with Python on real stock data

  • You will learn to quantitatively analyze you own portfolio and give it a reality check! 🙂

  • An Introduction to Backtesting Trading Strategies and Vectorization

  • Optimizing a Portfolio using state of the art tools

  • Advanced Trading Strategies using concepts of Optimization and Machine Learning

  • Building state of the art and beautiful Interactive Finance Dashboard

  • Learn about the powerful Intersection of Pandas & SQL and use it to leverage your knowledge

Why this course and no other one?

  • I am actively working in the field of quant Finance covering Data Science and quantitive Finance topics since several years and wrote my Master Thesis in quantitative Finance – I know what’s relevant in practice but also what is relevant to cover to level up!

  • I have taught Python for Finance and Automated Trading topics to over 75.000 people on YouTube and countless people privately.

  • You will get a lot of Quizzes, Exercises to apply what I taught and I will give you relevant tips and practical advise. I challenge you to solve all of the provided exercises! 🙂

  • There is no single time filler in this course. We are getting straight to the topics and I am being as brief as possible but also taking my time to be as specific as possible

  • Outstanding support: If you don’t understand something, you feel you are stuck or you simply want to connect with me just write me a message and I am getting back to you as soon as possible!

What are you waiting for? Click ‘Enroll now’  to get started! I am excited and looking forward to see you inside the course 🙂

Introduction

1
What does this course cover?
2
Disclaimer [MUST WATCH!]
3
How to get the most of this course?
4
Any questions or problems? Reach out!

Installation and Jupyter Notebook Basics

1
Download Anaconda & Set Up Jupyter Notebook
2
Jupyter Notebook Basics

Python Fundamentals

1
Variables & Single Datatypes
2
What you should NEVER do
3
Typecasting & User Input
4
Practice Time :-)
5
Arithmetic Operators
6
Comparison Operators / Logical Operators
7
Indentations & If-Statements
8
Practice Time :-)
9
Lists as objects with methods in Python
10
List Slicing & Indexing
11
Difference between lists & tuples
12
Dictionaries
13
For loops
14
Combining lists & loops: List comprehension
15
While loop
16
Practice Time :-)
17
Practice your knowledge with a common Interview question!
18
Functions

Fundamentals of Pandas

1
Setting up a DataFrame and DataFrame properties
2
Adding columns and using dictionaries for DataFrame initialization
3
New columns based on calculations
4
Data Selection with iloc
5
Data Selection with loc
6
Data Filtering with Boolean Masks and Boolean Indexing

Applied Financial Data Analysis

1
Pulling stock prices and OHLC data
2
Quick Recap on what we did in the last chapter
3
Return calculation with shift and pct_change
4
Important functions: diff, dropna, rolling
5
Very important argument: axis=0 or axis=1
6
Quiz Time!
7
nlargest and nsmallest
8
Bringing together Dataframes: Concat
9
Combining Time Series and OHLC in general
10
Resampling Data
11
Resampling OHLC Data
12
Plotting in Pandas
13
Iterating over a dataframe: Iterrows
14
Performance Comparison: Iterrows vs. Vectorization
15
Return calculation deep dive
16
Your turn!
17
Practice Task: Plot the yearly returns of the S&P500
18
Solution to the Practice Task: Plot yearly returns of the S&P500

Portfolio Analysis and Portfolio Management with Python

1
Portfolio Analysis Introduction
2
Variance, Standarddeviation, Covariance and Correlation
3
Portfolio Return and Risk
4
Portfolio Expected Return and Portfolio Risk using Python
5
Use the Dot Product to calculate Portfolio Return and Portfolio Risk
6
Application to real data: Portfolio of Microsoft, Coca Cola and Tesla
7
Efficient Frontier, Minimum Variance Portfolio and dominant Portfolios

Introduction to Backtesting Trading Strategies

1
Introduction and the Strategy
2
Coding the Trading Strategy (iterative approach)
3
Vectorizing the Backtest

Project I: Momentum Trading Strategies

1
Cross-sectional Momentum Part I: Survivorship Bias Handling
2
Cross-sectional Momentum Part II: Constructing and Backtesting
3
Time-Series Momentum

Project II: Backtesting JPMorgans Volatility Index (VIX) based Strategy

1
Backtesting JPMorgans Volatility Index (VIX) based Strategy

Project III: Stock Market Analysis Interactive Dashboards with Streamlit

1
Brief Intro to Streamlit
2
Streamlit Portfolio Analysis Dashboard
3
Streamlit Dashboard showing the Top and Worst S&P500 Index performers

Project IV: Machine Learning applied on Stock Data

1
A Machine Learning Model which (potentially) outperformed the S&P500
2
Least Squares Moving Average Trading Strategy

Project V: An advanced guide to Backtesting and Optimization on over 500 Stocks

1
Iterative Approach
2
Vectorized Approach
3
Results Analysis

Project VI: Optimizing a Portfolio based on the Sharpe Ratio

1
Recap on Matrix Operations (Expected return and Portfolio Risk)
2
Optimization of Portfolio weights

Extra Chapter: Pandas & SQL

1
The mighty Intersection between Pandas and SQL
2
How to update an SQL Database with Pandas and SQL
3
Build your own Finance DB using Pandas & SQL!
4
Build a simple Stock recommendation System with your Finance DB
5
Build an Intraday Stock Price Database with Python and SQL

What I would like to give you on your way! Thank you :-)

1
Thank you and something to take along!
You can view and review the lecture materials indefinitely, like an on-demand channel.
Definitely! If you have an internet connection, courses on Udemy are available on any device at any time. If you don't have an internet connection, some instructors also let their students download course lectures. That's up to the instructor though, so make sure you get on their good side!
4.8
4.8 out of 5
71 Ratings

Detailed Rating

Stars 5
52
Stars 4
16
Stars 3
3
Stars 2
0
Stars 1
0